The end result is going to look something like this.
You can see I have a couple different versions of the Skype for Business desktop client running, 2 Polycom phones, and a Yealink phone as well. So how do we create this report. Below I will detail it out step by step.
1. Create a new Power BI Report.
2. Click Get Data and fill out the SQL connection parameters to hit the RTCLOCAL instance.
3. Select Type Direct Query
4. Use the following Query
SELECT rtc.dbo.Resource.UserAtHost as 'SIP Address', CAST(rtcdyn.dbo.RegistrarEndpoint.ClientApp as varchar(100)) as 'Client Version'
FROM rtcdyn.dbo.RegistrarEndpoint
INNER JOIN rtc.dbo.Resource
ON rtcdyn.dbo.RegistrarEndpoint.OwnerId = rtc.dbo.Resource.ResourceId
WHERE IsServerSource = 0
You can test run this in SSMS to make sure it works prior if you like, the query should return all the user's SIP Addresses and the Client Version of all current logged in Skype for Business users.
5. Add the query to Power BI, make sure it looks good, and click Close and Apply.
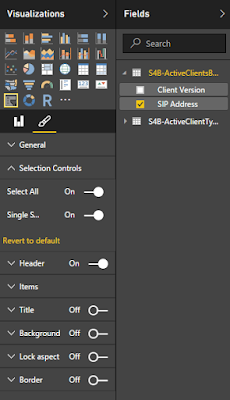
6. In the blank page for reports in Power BI, click the Slicer in Visualizations, and drag it over to the top left part of the page. Select SIP Address from your data set.

7. Turn on the select all option in case you want to see all users at one time.
8. Add a table to right of the slicer, and add both columns
9. Add a doughnut graph below the slicer and select the client version for the legend, then a count of the client version as the value.
10. Save and publish the report.
11. Find the report in your app.powerbi.com page, and select Visual Interactions.
12. Make sure you click the filter icon in the table and chart while you have the slicer selected.
13. Create a dashboard, and pin the live page to it. Note you can make your page 16:9, 4:3, a custom size, or scale it to fit Cortana. I would recommend sizing it to remove as much white space as possible so it gives you the best overall look.
Now you can view your dashboard with the 3 objects as one Power BI tile. Since we used direct query, as users sign in and out, or data will update as we refresh it. Next week I'll show you how to use my SQL Skype for Business timeclock data I blogged about a while back to create a report like this.
Doug Routledge, C# Lync, Skype for Business, SQL, Exchange, UC Developer
BridgeOC Twitter - @droutledge @ndbridge


This comment has been removed by the author.
ReplyDelete